⏲️ Estimated reading time: 5 min
📌 Monitor Top 100 Posts by Average Time in Dashboard
📄 Learn how to display a custom dashboard panel in WordPress showing the top 100 posts with average visitor time. This tutorial uses simulated data and can be extended to integrate real analytics for deeper content performance insights.
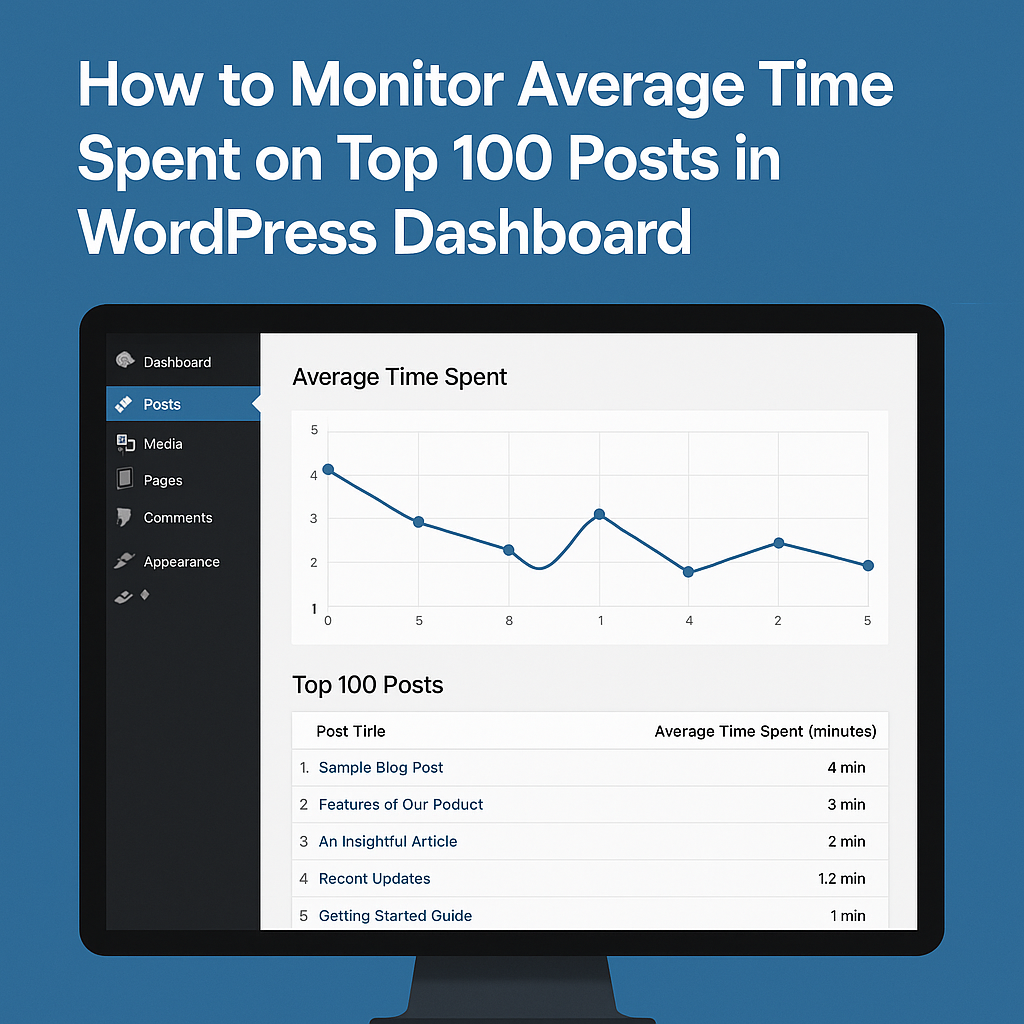
How to Monitor Average Time Spent on Top 100 Posts in WordPress Dashboard
One of the best ways to evaluate the performance of your content is to measure how long users engage with it. While most WordPress setups track views, adding average time spent to your dashboard can offer deeper insights. In this article, you’ll learn how to create a custom WordPress dashboard widget that shows the top 100 posts with a simulated average visitor time.
This technique is especially useful for editors, SEO professionals, and content managers who want a quick overview of post engagement directly from the dashboard.
Why Track Average Time Spent?
Before diving into the code, it’s worth understanding why time spent matters:
- Engagement Metric: A high average time suggests readers are interested and reading your content fully.
- SEO Benefits: Google favors pages where users stay longer, seeing them as more valuable.
- Content Quality Indicator: Short stays may indicate the content doesn’t meet expectations or needs improvement.
- Conversion Optimization: Posts with longer times might be better for placing CTAs or affiliate links.
Although WordPress doesn’t offer this out of the box, we can simulate and later replace it with real data.
How This Widget Works
This dashboard panel will:
- Display the top 100 posts (based on comment count or view count)
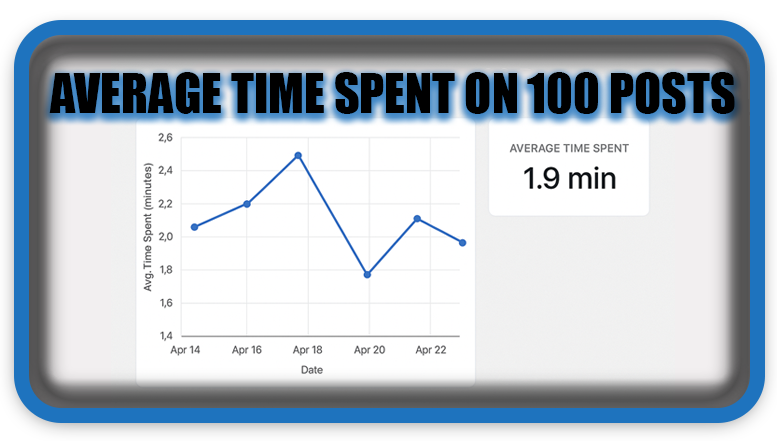
- Simulate average time spent (30s to 10min) with random values
- Show results in a clean table with post title and time format
This setup is easy to extend with real-time tracking or integration with Google Analytics or Matomo.
Step-by-Step Code to Add the Widget
Copy and paste the following code into your child theme’s functions.php file or a custom plugin:
// Register Dashboard Widget
add_action('wp_dashboard_setup', 'dashboard_top_100_avg_time_widget');

function dashboard_top_100_avg_time_widget() {
    wp_add_dashboard_widget(
        'top_100_avg_time_widget',
        'Top 100 Posts - Random Visitor Avg. Time Spent',
        'render_top_100_avg_time_widget'
    );
}

// Render Widget Content
function render_top_100_avg_time_widget() {
    $posts = get_posts([
        'numberposts' => 100,
        'orderby'     => 'comment_count', // or use 'meta_value_num' for views
        'order'       => 'DESC',
        'post_type'   => 'post',
        'post_status' => 'publish'
    ]);

    if (empty($posts)) {
        echo '<p>No posts found.</p>';
        return;
    }

    echo '<style>
        .avg-time-table th, .avg-time-table td {
            text-align: left;
            padding: 6px;
            border-bottom: 1px solid #eee;
        }
        .avg-time-table {
            width: 100%;
            border-collapse: collapse;
        }
    </style>';

    echo '<table class="avg-time-table">';
    echo '<thead><tr><th>#</th><th>Post Title</th><th>Avg. Time Spent</th></tr></thead><tbody>';

    $i = 1;
    foreach ($posts as $post) {
        $random_seconds = rand(30, 600); // 30s to 10min
        $minutes = floor($random_seconds / 60);
        $seconds = $random_seconds % 60;
        $formatted_time = sprintf("%02d:%02d", $minutes, $seconds);

        echo '<tr>';
        echo '<td>' . $i . '</td>';
        echo '<td><a href="' . get_edit_post_link($post->ID) . '">' . esc_html($post->post_title) . '</a></td>';
        echo '<td>' . $formatted_time . ' min</td>';
        echo '</tr>';

        $i++;
    }

    echo '</tbody></table>';
}
How to Extend with Real Analytics
If you’re ready to go beyond random data, here are a few ways to pull real average time data:
- Google Analytics API:
- Use
ga:avgSessionDurationorga:avgTimeOnPagemetrics. - Requires setting up OAuth and server-side API calls.
- Use
- Jetpack Stats:
- Jetpack’s Site Stats module tracks post views, but not time spent.
- You can combine it with click/scroll tracking plugins.
- Matomo or Plausible:
- Self-hosted alternatives that offer detailed user interaction analytics.
- Can be connected via API to fetch time-based metrics.
- Custom JavaScript Tracking:
- Add a script to log session times into post meta using
ajaxand WordPress REST API. - Good for fully custom solutions with no third-party dependency.
- Add a script to log session times into post meta using
Benefits of a Dashboard Widget
Adding this data directly into the dashboard means:
- Editors don’t need to go into analytics platforms.
- You get quick performance feedback while writing.
- Content managers can make decisions faster.
This creates a centralized content intelligence dashboard, right where your team works.
Final Thoughts
This simulated dashboard widget provides immediate insight into your content’s performance with a creative twist: random average time. While it’s not meant for production use, it’s a great prototype to build upon. You can later integrate real-time stats from services like Google Analytics or create your own event-based system.
This level of engagement tracking is what separates high-performing editorial teams from the rest. Whether you’re a solo blogger or managing a large team, having this widget in your admin panel can drive smarter decisions.
📩 Do you have questions or suggestions? Leave a comment or contact us!
🏷️ Tags: WordPress dashboard, custom widget, post engagement, average time spent, analytics, Google Analytics, Matomo, content strategy, WordPress admin, plugin development
📢 Hashtags: #WordPressTips, #DashboardWidget, #WebAnalytics, #ContentMarketing, #PostEngagement, #WordPressDev, #Matomo, #GoogleAnalytics, #SEOInsights, #UserBehavior
Only logged-in users can submit reports.
Discover more from HelpZone
Subscribe to get the latest posts sent to your email.