⏲️ Estimated reading time: 6 min
🧠 Add a Radar Chart to WordPress Dashboard with Chart.js
📝 Easily visualize your website’s performance using a radar chart in the WordPress dashboard. This tutorial shows you how to create a custom plugin that adds a beautiful Chart.js radar graph to track posts, visitors, comments, and more.
📊 Add a Radar Chart to the WordPress Dashboard Using Chart.js
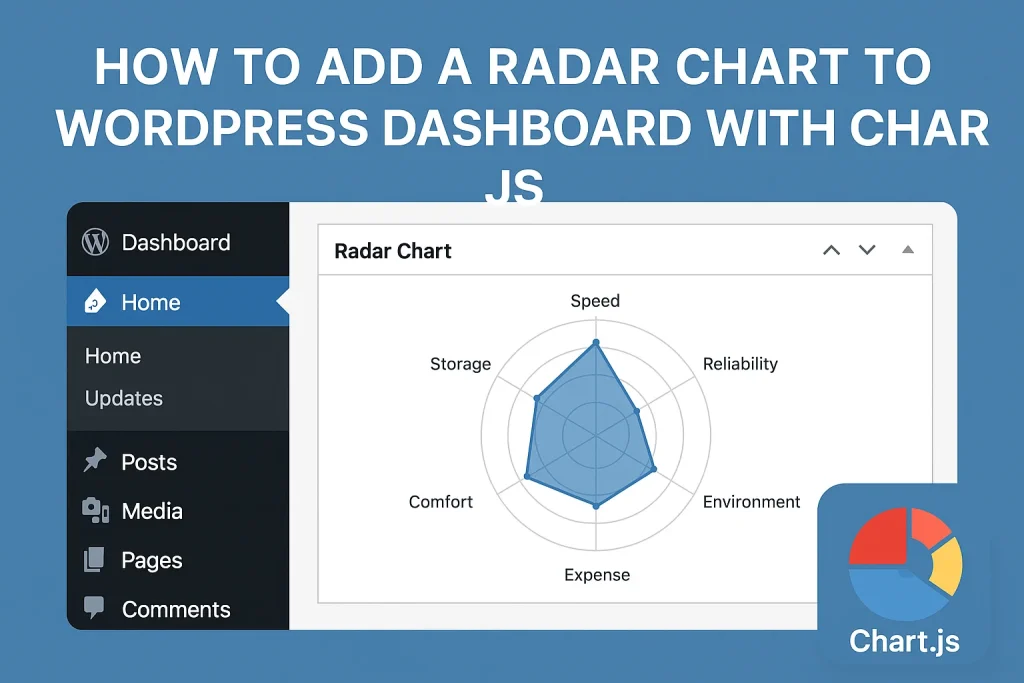
WordPress is a powerful content management system, but its default dashboard lacks modern, visual insights. What if you could add a radar chart that visually represents key site activities such as posts, comments, likes, and visitors directly inside your dashboard?
This guide walks you through creating a custom plugin that injects a beautiful radar chart using Chart.js right into your WordPress dashboard. No premium tools or third-party APIs needed just raw data visualization built with JavaScript and PHP.
🚀 Why Add a Radar Chart to the Dashboard?
A radar chart, also known as a spider chart or web chart, offers a unique way to compare multiple quantitative variables. In a WordPress context, this could include metrics such as:
- Total Posts Published
- Number of Comments
- Unique Visitors
- Likes Received
- Content Shares
Visualizing this data helps administrators and editors monitor site performance at a glance, without needing to dig into complex analytics platforms.
🔧 Plugin Setup: Radar Dashboard Widget
Below is the complete code for creating the radar chart widget. You can save this code in a file named radar-dashboard-widget.php and place it inside the wp-content/plugins/ directory of your WordPress installation.
<?php
/**
 * Plugin Name: Radar Dashboard Widget
 * Description: Adds a radar chart to the WordPress dashboard displaying sample data.
 * Version: 1.0
 * Author: HelpZone
 */

add_action('wp_dashboard_setup', 'hz_add_radar_widget');

function hz_add_radar_widget() {
    wp_add_dashboard_widget(
        'hz_radar_dashboard_widget',
        'Radar Overview',
        'hz_render_radar_dashboard_widget'
    );
}

function hz_render_radar_dashboard_widget() {
    ?>
    <canvas id="hzRadarChart" width="400" height="400"></canvas>

    <script src="https://cdn.jsdelivr.net/npm/chart.js"></script>
    <script>
    const ctx = document.getElementById('hzRadarChart');
    new Chart(ctx, {
        type: 'radar',
        data: {
            labels: ['Posts', 'Comments', 'Visitors', 'Likes', 'Shares'],
            datasets: [{
                label: 'Site Activity Overview',
                data: [75, 40, 90, 55, 30], // Example data
                fill: true,
                backgroundColor: 'rgba(54, 162, 235, 0.2)',
                borderColor: 'rgb(54, 162, 235)',
                pointBackgroundColor: 'rgb(54, 162, 235)'
            }]
        },
        options: {
            responsive: true,
            scales: {
                r: {
                    beginAtZero: true
                }
            },
            plugins: {
                legend: {
                    display: true
                },
                title: {
                    display: true,
                    text: 'Radar Chart - Site Stats'
                }
            }
        }
    });
    </script>
    <?php
}

📁 How to Install the Plugin
- Create the Plugin File
- Create a new file:
radar-dashboard-widget.php - Paste the code above into the file
- Create a new file:
- Upload to WordPress
- Place the file in the
wp-content/plugins/folder via FTP or File Manager - Alternatively, compress the file into a
.zipand use Plugins > Add New > Upload Plugin
- Place the file in the
- Activate the Plugin
- Go to Plugins > Installed Plugins
- Locate “Radar Dashboard Widget” and click Activate
🛠️ Customizing the Radar Chart Data
The data array in the datasets section is currently hardcoded:
data: [75, 40, 90, 55, 30] // Posts, Comments, Visitors, Likes, SharesYou can modify this dynamically using WordPress functions such as:
wp_count_posts()->publish
get_comments_number()
To fetch live data, you’ll need to inject PHP values into the JavaScript section. Here’s a basic way to do it:
$posts = wp_count_posts()->publish;
$comments = wp_count_comments()->approved;
$visitors = 90; // Replace with actual tracking logic
$likes = 55;    // Use post meta or plugin-specific methods
$shares = 30;   // External service or estimated value
Then, you can use PHP echo statements inside JavaScript like so:
data: [<?php echo $posts; ?>, <?php echo $comments; ?>, <?php echo $visitors; ?>, <?php echo $likes; ?>, <?php echo $shares; ?>]🎨 Styling the Chart Area
The canvas is placed with basic dimensions:
<canvas id="hzRadarChart" width="400" height="400"></canvas>You can adjust this using CSS or wrap it inside a <div> container for better responsiveness. Consider applying styles directly or enqueueing a custom CSS file.
📊 Benefits of Using Chart.js in WordPress
Chart.js is:
- Lightweight (only ~60KB minified and gzipped)
- Responsive by default
- Highly customizable
- No jQuery needed
- Perfect for modern WordPress admin panels
Since it uses HTML5 <canvas>, it works smoothly even on older browsers.
🧩 Extend Further: Add More Widgets
Want more than just radar charts?
You can build similar widgets using:
- Line Charts (traffic over time)
- Pie Charts (category distribution)
- Bar Charts (top post performance)
Each can be added as a separate dashboard widget using wp_add_dashboard_widget.

💡 Pro Tip: Track Real Data
If you want this plugin to show actual statistics from your site, consider integrating:
- Google Analytics API
- WP Statistics plugin hooks
- Custom counters from plugins like Jetpack
With those, your chart updates with live data every time the dashboard loads.
🧪 Debugging Tips
- Ensure JavaScript loads after Chart.js place
<script src=...>before the chart code - Use browser dev tools to debug JavaScript
- If the chart doesn’t render, check for console errors (e.g., missing canvas or chart.js errors)
- Clear your browser cache after plugin updates
📦 Plugin Packaging Suggestions
If you plan to distribute this plugin:
- Place the file in a folder:
radar-dashboard-widget/ - Add a
readme.txtwith a description, version, and installation steps - Zip the folder and upload to WordPress plugin directory or your own site
🏁 Final Thoughts
A radar chart brings dynamic visual clarity to your admin panel. Instead of looking at boring text stats, you now get an eye-catching spider graph that gives you a full-site overview at a glance. Best of all it’s free, lightweight, and totally customizable.
🔔For more tutorials like this, consider subscribing to our blog.
📩 Do you have questions or suggestions? Leave a comment or contact us!
🏷️ Tags: WordPress, Dashboard Widget, Chart.js, Plugin Development, Admin UI, Radar Chart, WordPress Plugins, Data Visualization, JavaScript Charts, WordPress Admin
📢 Hashtags: #WordPress, #ChartJS, #RadarChart, #WPPlugin, #DashboardWidget, #WebDevelopment, #SiteStats, #AdminPanel, #DataVisualization, #WPDev
🔍 Wrap-Up Section
Adding custom widgets to your WordPress dashboard gives you control, insight, and elegance. This radar chart plugin is a great first step into transforming your admin experience into a data-driven cockpit. Try it out and explore how far you can take visual WordPress admin enhancements.
Only logged-in users can submit reports.
Discover more from HelpZone
Subscribe to get the latest posts sent to your email.

