⏲️ Estimated reading time: 3 min
Mastering candlestick patterns is essential for traders seeking to predict market moves. Learn the top 8 buy and sell signals from charts like Bullish Engulfing, Hammer, and Shooting Star.
Candlestick patterns are a cornerstone of technical analysis in financial markets. They provide visual cues about market sentiment and potential price movements. Whether you’re trading stocks, forex, or crypto, understanding these patterns can give you a valuable edge. Below, we break down the 8 most essential candlestick patterns four that signal buy opportunities and four that suggest sell signals.
BUY Signals: Time to Enter Long
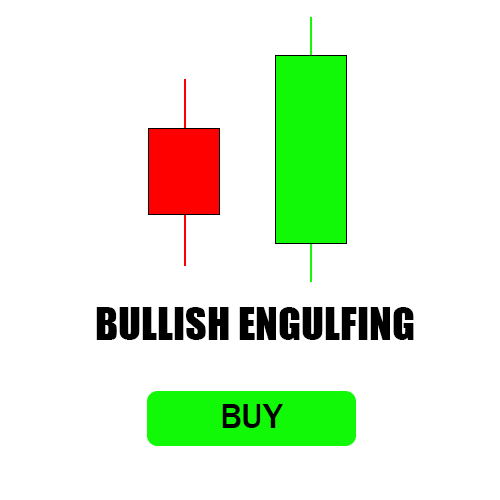
1. Bullish Engulfing
This pattern appears after a downtrend. It consists of a small red (bearish) candle followed by a large green (bullish) candle that fully engulfs the previous one. The pattern signals a potential reversal to the upside, suggesting that buyers have taken control.
Key Characteristics:
- Second candle opens lower and closes higher than the first
- Strong bullish momentum shift
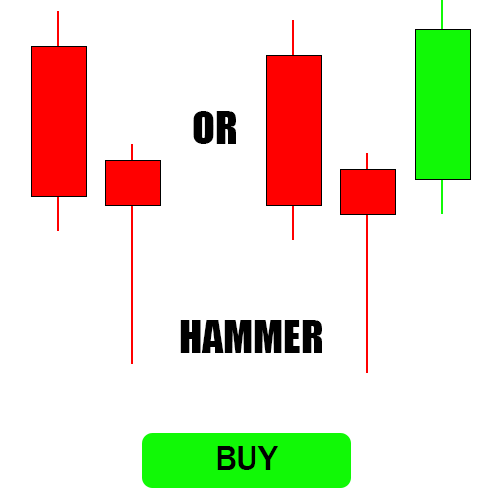
2. Hammer
A single candle with a small body and a long lower wick, the Hammer indicates that sellers tried to push the price down but failed, and buyers regained control. It’s often found at the bottom of a downtrend.
Key Characteristics:
- Long lower shadow at least twice the body
- Little to no upper wick
- Appears after a price decline
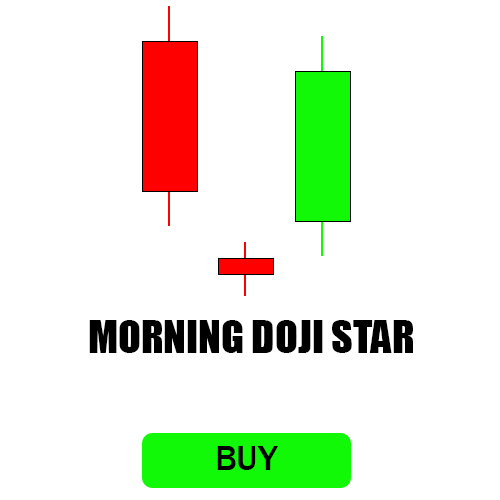
3. Morning Doji Star
This is a three-candle reversal pattern:
- A large red candle
- A doji (indecision candle with little or no body)
- A strong green candle that closes above the midpoint of the first
It shows a transition from bearish momentum to bullish.
Key Characteristics:
- Gaps between candles
- Reflects market indecision followed by buyer strength
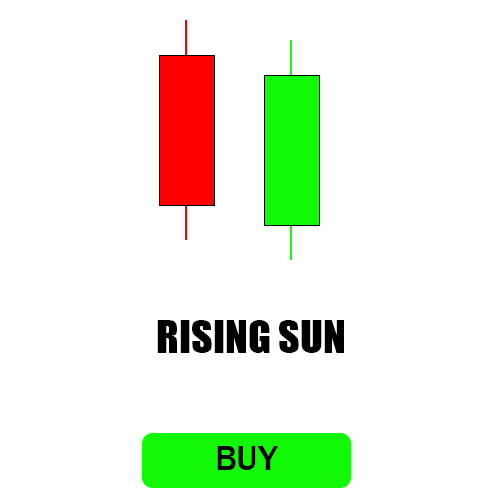
4. Rising Sun
Also a bullish reversal pattern, this resembles a “Morning Star” and shows the market bottoming out before a rally. It’s a sign of new upward energy entering the market.
Key Characteristics:
- Downtrend followed by a gap
- Strong green candle to finish the pattern
SELL Signals: Time to Exit or Go Short
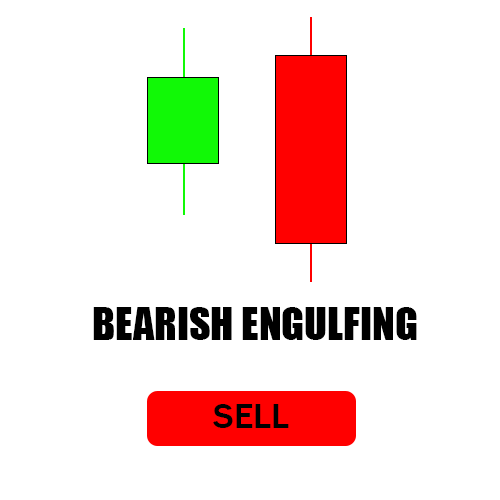
5. Bearish Engulfing
The opposite of the Bullish Engulfing. A small green candle is followed by a large red candle that engulfs it completely. This suggests that sellers have taken over after an uptrend.
Key Characteristics:
- Appears at market tops
- Second candle closes below the first’s open
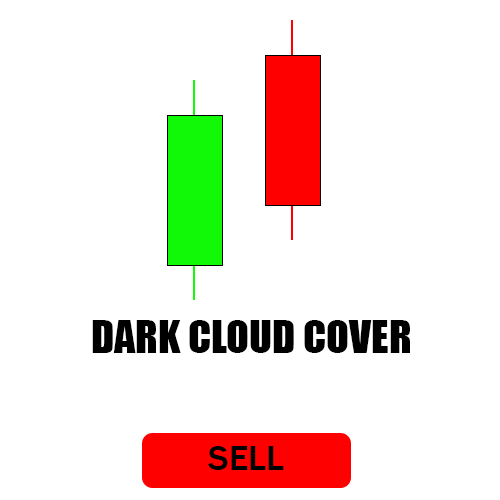
6. Dark Cloud Cover
This two-candle pattern starts with a strong green candle. The next red candle opens higher but closes below the midpoint of the previous candle. It indicates weakening bullish sentiment.
Key Characteristics:
- Appears at the top of an uptrend
- Strong bearish implication if volume is high
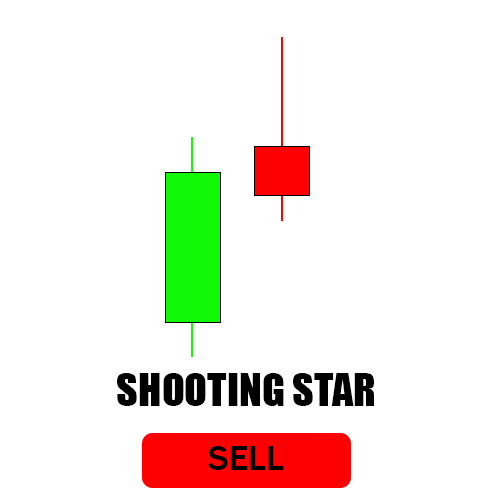
7. Shooting Star
A single candle with a small body and a long upper wick. It signals a potential top, where buyers pushed prices up but were overwhelmed by sellers before the close.
Key Characteristics:
- Long upper shadow
- Appears after a price rally
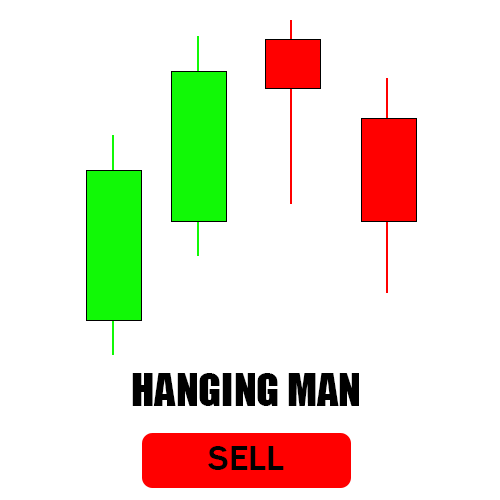
8. Hanging Man
Looks similar to the Hammer but appears at the top of an uptrend. It indicates that selling pressure is building and a reversal may be near.
Key Characteristics:
- Long lower wick, small body
- Signals market exhaustion
Final Thoughts
Candlestick patterns are powerful tools when combined with other indicators like volume, trendlines, and support/resistance zones. While no single pattern guarantees a market move, understanding these 8 can significantly improve your chart-reading skills and trading decisions.
Tags: candlestick patterns, technical analysis, stock trading, crypto trading, forex trading, bullish patterns, bearish patterns, trading strategies, market indicators, chart analysis
Only logged-in users can submit reports.
Discover more from HelpZone
Subscribe to get the latest posts sent to your email.